
Ohio maps
The Ohio map shows the state outline and 88 county-level divisions . Compare the two views below and download either as SVG or PNG.
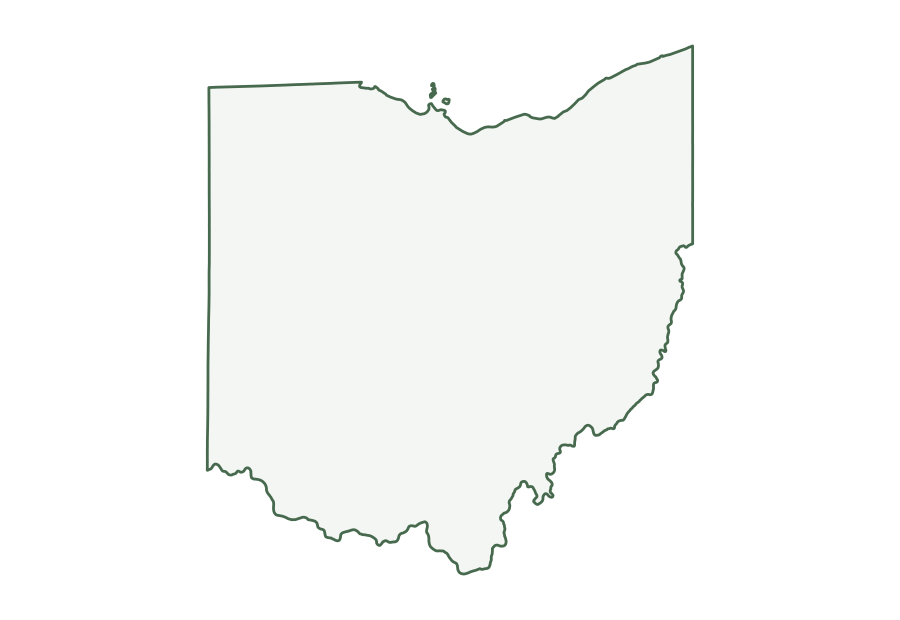
Preview the blank outline of Ohio
Ohio in the source file
The Census Bureau identifies Ohio with postal abbreviation OH and state FIPS code 39. Its 2025 county file has 88 county-level records. The fine lines in the first image trace those divisions within the state outline.
| Postal abbreviation | OH |
|---|---|
| State FIPS code | 39 |
| County-level records | 88 |
| Land area | 40,859 sq mi |
| Water area | 3,967 sq mi |
| Land area rank | 35 of 50 states |
The area figures are rounded conversions of the square-meter attributes in the state file. Water accounts for 8.8% of the file’s combined land and water area for Ohio; that figure describes the source data, not a shaded portion of the SVG. The land rank compares the 50 states in this same file and excludes Washington, D.C.
What is on the map?
The blank version isolates the outer boundary. The county and equivalent map adds boundaries from the matching 2025 county file. Some states include county equivalents as well as counties; the alphabetical list below uses the Census names for each record. The maps omit roads, city names, terrain, and current travel information.
The files are based on the Census Bureau’s national 1:5,000,000 cartographic boundaries. The dataset is generalized for display, so small islands and fine bends along a coast or river may be simplified. The source scale describes the boundary detail; enlarging the SVG keeps its lines sharp but does not add geographic precision. For local analysis or a legal boundary question, use an appropriate larger-scale official dataset.
County-level names in this map
The alphabetical names below come from the same 2025 county file used to draw the internal lines. Hover over a division in the map above to see its name. The names appear as tooltips and are not printed on the map; the list below is useful on touch screens and when looking up a name alphabetically.
Show all 88 names
- Adams County
- Allen County
- Ashland County
- Ashtabula County
- Athens County
- Auglaize County
- Belmont County
- Brown County
- Butler County
- Carroll County
- Champaign County
- Clark County
- Clermont County
- Clinton County
- Columbiana County
- Coshocton County
- Crawford County
- Cuyahoga County
- Darke County
- Defiance County
- Delaware County
- Erie County
- Fairfield County
- Fayette County
- Franklin County
- Fulton County
- Gallia County
- Geauga County
- Greene County
- Guernsey County
- Hamilton County
- Hancock County
- Hardin County
- Harrison County
- Henry County
- Highland County
- Hocking County
- Holmes County
- Huron County
- Jackson County
- Jefferson County
- Knox County
- Lake County
- Lawrence County
- Licking County
- Logan County
- Lorain County
- Lucas County
- Madison County
- Mahoning County
- Marion County
- Medina County
- Meigs County
- Mercer County
- Miami County
- Monroe County
- Montgomery County
- Morgan County
- Morrow County
- Muskingum County
- Noble County
- Ottawa County
- Paulding County
- Perry County
- Pickaway County
- Pike County
- Portage County
- Preble County
- Putnam County
- Richland County
- Ross County
- Sandusky County
- Scioto County
- Seneca County
- Shelby County
- Stark County
- Summit County
- Trumbull County
- Tuscarawas County
- Union County
- Van Wert County
- Vinton County
- Warren County
- Washington County
- Wayne County
- Williams County
- Wood County
- Wyandot County
Choosing and printing a file
Use the blank outline when you plan to add your own labels or use the shape in a worksheet. Use the county-level version when the internal divisions matter. SVG is a vector format that stays clear when resized in a browser or compatible editor. PNG is a fixed 1,800 × 1,240 pixel image for software that does not accept SVG. Both show the same source boundaries. The printing guide explains paper size, margins, and attribution.
For a road or topographic map, use a source that includes those layers. The USGS National Map provides downloadable topographic maps and other geographic data. Our map types guide compares the purpose of each kind of map.
Source and attribution
Source: U.S. Census Bureau, 2025 Cartographic Boundary Files , national state and county KML at 1:5,000,000 scale. USA State Maps transformed those coordinates into the files above. When sharing an image, include the Census Bureau as the boundary source and retain the year and scale so readers can understand its limits.